In today’s rapidly evolving world, gathering and analysing vast amounts of data is crucial for informed decision-making. Earth Observation (EO) data, with its remarkable versatility, plays a pivotal role in providing insights across multiple industries—from environmental monitoring to urban planning and beyond. As José Laffitte, Head of Engineering at Cactus and author of this article, explains: “EO data is incredibly versatile and is used to enhance understanding and decision-making across various domains and applications.” We invite you to learn more about the transformative impact of EO data and its wide range of applications.
One of the most impactful applications of EO data can be seen in agriculture, where it optimises farming practices and enhances productivity. By analyzing satellite images and sensor data, farmers can monitor the health of crops, assess soil moisture levels, and detect potential threats like pests or diseases. This real-time information allows for more precise use of water and fertilizers, leading to higher yields and reduced environmental impact.
In recent years, the field of EO has revolutionized the way we monitor and manage infrastructure. Leveraging data collected from satellites, drones, and ground-based sensors, EO provides a comprehensive and real-time perspective on the Earth’s surface. This technology is crucial for understanding the condition and performance of infrastructure systems such as roads, bridges, pipelines and cable lines.
Satellite data includes various types of information, such as imagery, radar, and spectral data, which can be analyzed to extract valuable insights about the physical and environmental state of the Earth. Depending on the nature of the sensing instrument (whether it is passive or active) and the wavelength of the electromagnetic spectrum in which the observation is made, we can categorize the imaging types based on whether the instrument needs the ability to both send and receive an electromagnetic signal or only receive it.
Passive imagery
In passive imagery systems, sensors are designed to detect electromagnetic emissions from the Earth’s surface and atmosphere’s components. These emissions may originate locally, such as radiation from vegetation during the photosynthesis process, or result from sunlight reflected in the visible spectrum. As passive imagery relies on natural light sources, it is typically dependent on the day-night cycle and can be hindered by factors like cloud cover or other atmospheric disturbances, which obstruct the detection of surface emissions. In passive imagery systems, several types of images can be generated based on the electromagnetic spectrum’s different segments, among others:
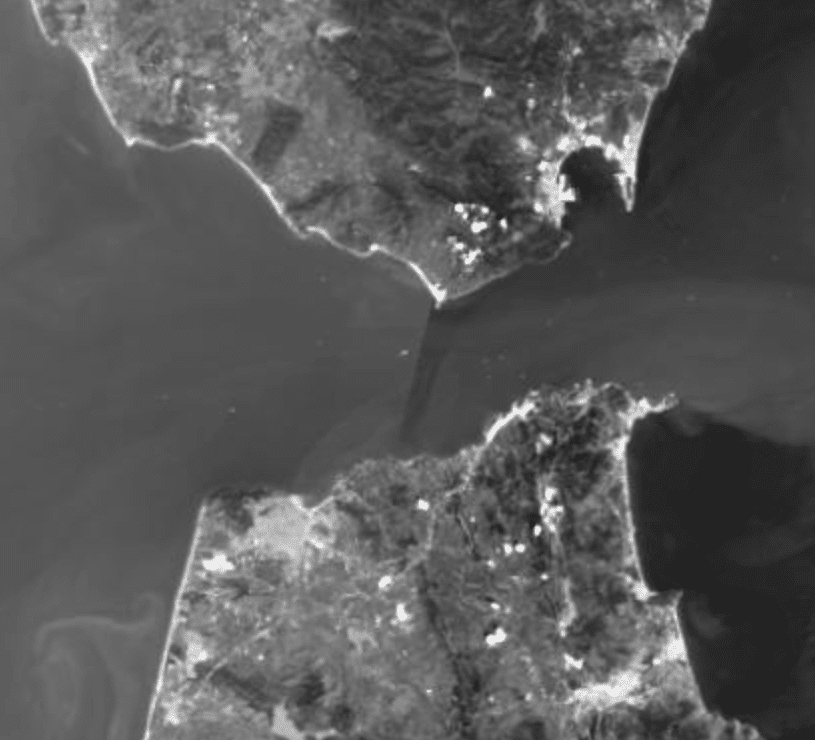
- Panchromatic images: result of the measure of light intensity over a broad range of the electromagnetic spectrum. Collecting light from a wide range of wavelengths allows for more energy to be collected and hence high-resolution images. This way we can generate visible spectrum images displayed as shades of grey or, using thermal infrared sensors, we can measure regions where the ground or the ocean is warm, as they will emit the most intense radiation. It provides better resolution than multispectral images.
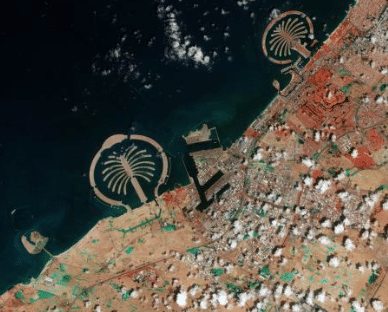
Multi-spectral images: the result of remote sensing in an observed scene while using several narrow bands of the electromagnetic spectrum. Since the range of wavelengths contributing to the radiation energy detected by the sensor is reduced, multispectral images will result in a lower resolution than panchromatic images. A common use is the production of “natural colour” by combining the measurements in 3 bands of the visible spectrum (narrow bands centered around blue, green and red wavelengths).
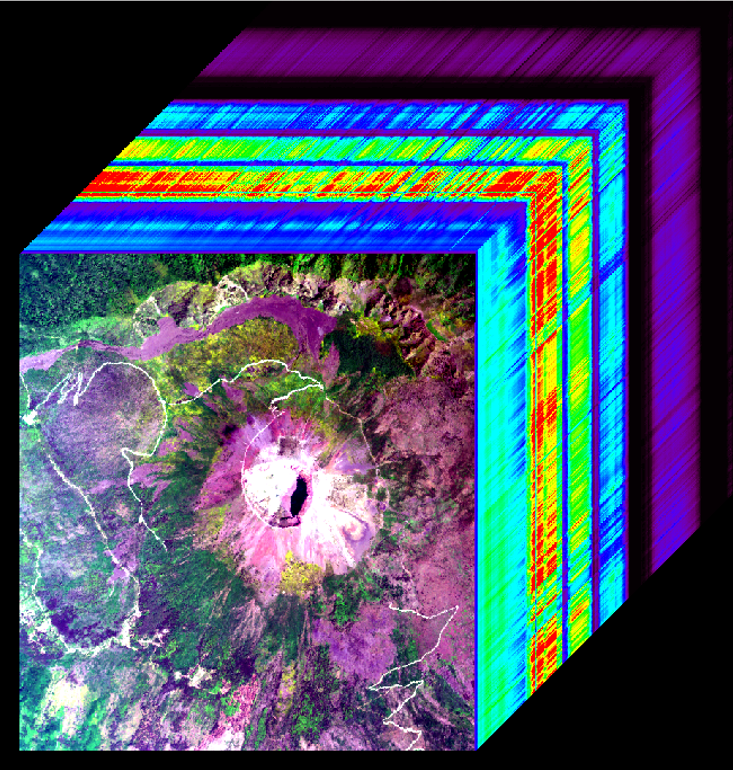
Hyperspectral images: for each pixel, a hyperspectral sensor acquires the light intensity for a large number (usually a few tens to some hundreds) of contiguous narrow spectral bands. Every pixel in the image is then attached to a nearly continuous spectrum. The high spectral resolution of a hyperspectral image allows for the detection, identification and quantification of surface materials, as well as inferring biological and chemical processes.
Active imagery
In active imagery systems, instruments are composed of a transmitter that sends out a specific electromagnetic signal and a sensor receiving the interaction of the sent signal with the Earth’s surface. Because of this, such observations are not dependent on solar illumination.
- SAR (Synthetic aperture radar): this instrument transmits electromagnetic pulses towards the Earth’s surface where they are reflected or scattered by the surface features. The antenna can detect and record the returned pulses, their intensity and the time it takes to arrive back at the antenna is used to generate SAR imagery. The main advantage of SAR is it is not sensitive to the day/night cycle and most meteorological conditions (heavy intense rain cells can disturb it). SAR imagery can be used for ship detection, critical infrastructure or oil spill detection, for example.
- Lidar (Light Detection and Ranging): uses the same principle as SAR but works in the infrared, visible or ultraviolet wavelengths. Lidars are used for precise measurement of topographic features, profiling clouds and measuring winds, among others.
- Radar altimetry: radar altimetry is an active sensors that use the ranging capability of radars to measure the surface topography profile along the satellite track. They provide precise measurements of a satellite’s height above the ocean by measuring the time interval between the transmission and reception of very short electromagnetic pulses. This can be useful to infer the ocean and land topography, the lateral extent of sea ice or the altitude of large icebergs above sea level.
- GNSS-R (GNSS Reflectometry): it is a relatively new category of satellite navigation applications which consists of a method of remote sensing to receive and process microwave signals reflected from various surfaces to extract information about them. In this process, the GNSS satellite acts as a transmitter and an aeroplane or Low Earth Orbit (LEO) satellite as the receiving platform. It can be used for sea-wind retrieval and measurement of seawater salinity or ice-layer density, for example.
- Radar scatterometry: microwave radar sensor used to measure the reflection or scattering effect produced while scanning the surface of the Earth from an aircraft or a satellite, providing a measure of wind speed and direction near the sea surface. The radar scatterometer measures the backscatter from small waves at the sea surface at skew incidence angles. From these sea roughness measurements the wind vector at 10 m height is calculated, it can also be used to provide information about sea ice cover.
Constellations
When discussing Earth Observation, a variety of satellite constellations and data platforms are available, each offering unique capabilities and services. Satellite constellations like Sentinel, Planet, Iceye, and Satellogic operate and manage distinct constellations providing access to different types of images and data.
On the other hand, platforms such as UP42, the ESA Data Catalogue, and Google Earth Engine aggregate and offer streamlined access to EO data, making it easier to collect and analyze this information.
With so many options, users can select the constellation and platform that best fits their specific needs for extracting and analyzing EO data. Here’s an overview of some notable satellite operators and constellations:
Landsat
Landsat is a long-running Earth observation program, jointly managed by NASA and the U.S. Geological Survey (USGS), that has been capturing satellite imagery of Earth’s surface since 1972. The program’s satellites, equipped with advanced imaging sensors, continuously monitor and document changes in land use, ecosystems, and natural resources.
The Landsat program has launched a total of 9 satellites since its inception in 1972. Out of these 9, Landsat 8 and Landsat 9 remain operational at the time of writing this article. This consistent, high-resolution data source allows scientists and policymakers to study long-term environmental trends, such as deforestation, urbanization and climate change. By making this imagery freely accessible, Landsat has become an essential tool for global environmental research, resource management and disaster response.
Sentinel
The Sentinel satellites are part of the European Union’s Copernicus Earth Observation Program, managed by the European Space Agency (ESA). This constellation provides high-quality, open-access data to users worldwide, covering a broad range of EO applications.
- Sentinel-1: This satellite uses Synthetic Aperture Radar (SAR) technology, enabling it to capture images regardless of weather conditions or daylight. It is essential for monitoring land movements, flooding, and deforestation, as well as providing all-weather, day-and-night imagery.
- Sentinel-2: Focused on high-resolution optical imagery, Sentinel-2 is crucial for land monitoring, including vegetation, soil, and water cover changes. It’s widely used in agriculture, forestry, and disaster management. It is constituted by Sentinel-2A and Sentinel-2B, both of them in the same orbit but separated by 180º to optimize the revisit time and coverage. Sentinel-2C will be substituting Sentinel-2A, being launched on 4th September 2024, and Sentinel-2D will be substituting Sentinel-2B in 2028.
- Sentinel-3: This satellite provides data for ocean and atmospheric monitoring. It measures sea surface temperature, ocean color, and land surface temperatures, playing a vital role in environmental and climate monitoring.
- Sentinel-5P: Specializes in atmospheric composition, Sentinel-5P monitors air quality and tracks gases like ozone and nitrogen dioxide, helping scientists understand air pollution and its impact on health.
Sentinel satellites are renowned for their comprehensive and free-to-access data, which makes them widely used in scientific research and by government agencies.
Pleiades
The Pleiades constellation is a high-resolution Earth observation satellite system operated by Airbus Defense and Space. It is part of the Airbus optical imaging satellite family and is recognized for its ability to capture very detailed imagery with sub-meter resolution. The Pleaides constellation consists of 2 identical satellites, Pleaides 1A and Pleaides 1B, which work together to provide highly accurate and frequent images of the Earth’s surface.
They are known for their high spatial resolution, capturing both panchromatic and multispectral images at a resolution of 50 cm. Pleiades satellites also can capture stereoscopic images, which means they can take pictures of the same area from slightly different angles, allowing the creation of 3D models and orthorectified images.
They are also in a sun-synchronous orbit, meaning they pass over the same location at the same solar time, ensuring consistent lighting conditions. Together, the 2 satellites offer a daily revisit capability to any point on Earth, they are also highly agile, capable of reorienting themselves to capture images of specific locations.
Iceye
Iceye is a Finnish company that focuses on Synthetic Aperture Radar (SAR) technology, similar to Sentinel-1, but with a distinct emphasis on rapid data acquisition and high revisit rates. Iceye operates a commercial SAR satellite constellation that provides frequent, high-resolution images of the Earth.
As of 2024, ICEYE operates the largest SAR satellite constellation in the world, with over 34 satellites launched since 2018. The company plans to continue expanding its constellation by launching up to 13 new satellites in 2024 and an additional 10-15 annually in subsequent years
Iceye’s data is particularly valuable for industries and governments that require near-real-time insights in challenging environments, such as maritime monitoring, insurance, and security.
Planet
Planet Labs is a leading private EO provider known for its “Dove” constellation, which consists of small, low-cost satellites designed to capture high-resolution optical imagery of the Earth daily.
As of 2024, Planet Labs has approximately 200 active satellites in orbit, including their Dove and SkySat constellations. This fleet captures over 25 terabytes of imagery daily.
SkySat satellites are about the size of a small refrigerator, they provide imagery at a sub-meter resolution (around 50 cm per pixel). They focus on capturing high-resolution imagery and video for applications requiring detailed imagery, like mapping, infrastructure monitoring and intelligence gathering.
Dove satellites are CubeSats, which are small and lightweight (the size of a shoebox). They capture images with a resolution of about 3-5 meters per pixel, not as high as SkySat but they allow a high-frequency Earth observation and are primarily used for monitoring environmental changes, agricultural applications, and disaster response.
Planet’s ability to offer continuous monitoring with a high revisit frequency makes it a popular choice for commercial applications where up-to-date data is crucial.
Satellogic
Satellogic is an Argentinian company operating a constellation of small, high-resolution Earth observation satellites. Its business model focuses on providing affordable EO data with high spatial resolution, catering to a wide range of industries.
Satellogic has launched over 40 satellites as of May 2024. These satellites are part of its NewSat (Aleph-1) constellation, which aims to provide high-frequency, high-resolution imagery of the Earth. The company is actively expanding its constellation and it is planning to significantly increase the number of satellites in orbit in the coming years
Satellogic satellites capture multispectral and hyperspectral imagery, which allows for detailed analysis of the Earth’s surface. This data is used in agriculture, energy, forestry, and urban monitoring, among other fields.
Satellogic aims to democratize access to satellite imagery, enabling users in developing markets to leverage EO data for decision-making and problem-solving.
EO data platforms
Earth Observation data aggregators play a pivotal role in making EO data accessible and usable for a wide range of applications. EO data aggregators like the Copernicus Contributing Mission and platforms such as UP42 aggregate, process, and distribute data from various satellite sources, while constellations like Copernicus and Pleiades provide the raw satellite imagery
Each of these EO providers brings distinct strengths, catering to different needs based on the type of data, frequency of updates, and the specific challenges they are designed to address.
UP42
UP42 is a geospatial data and analytics platform that allows users to access and analyze EO data from multiple sources. It operates as a marketplace and a platform-as-a-service (Paas), enabling businesses, researchers, and developers to create customized geospatial solutions by combining different data sources and algorithms.
Copernicus Contributing Mission Program
The Copernicus program is a major Earth observation initiative led by the European Union in partnership with the European Space Agency (ESA). Its primary goal is to provide accurate, timely, and easily accessible information about the state of the environment.
It provides several platforms and tools, some of which are;
Copernicus Open Access Hub: This is the main portal for accessing Sentinel data. It allows users to search for and download datasets, including imagery and other environmental data.
Copernicus Services: These services provide tailored information and analysis derived from Sentinel satellite data, supporting a wide range of applications. For instance, Copernicus offers detailed data on climate variables and trends, enabling monitoring of changes in temperature, precipitation, and other key climate indicators. It also delivers valuable insights on land use and land cover, helping to track deforestation, urban expansion, and agricultural activities. Additionally, Copernicus supports services in marine monitoring, atmospheric composition analysis, and emergency response, offering critical information for disaster management, environmental protection, and policy-making across Europe and globally.
Copernicus Data and Information Access Services (DIAS): These platforms offer cloud-based access to Copernicus data and processing tools. They facilitate data management and analysis by providing scalable storage and computational resources.
Enabling actionable insights from Earth Observation data
We do foresee an important growth in satellite capabilities and larger possibilities to access and explode EO data to convert it into tangible and actionable information. As a consequence, the amount of use cases and options encourages developers to create software solutions to tasks that, without EO data, can be time-consuming, expensive or, simply, impossible.
With the arrival of AI and EO data availability in platforms like ESA Data Catalogue, anyone can train machine learning models, for example, a neural network, to monitor, analyze, track, and several other tasks yet to be discovered without any special equipment. Considering the Universal theorem of approximation, which describes how the output of a specific neural network is dense in the function space (there exists a neural network with the necessary conditions to describe any desired performance), any process can be automated.
Several Earth observation projects are currently in development, some of those being NASA’s Earth System Observatory (ESO), which includes multiple missions such as the Atmosphere Observing System (AOS), Surface Biology and Geology, and GRACE-Continuity (Mass Change), to answer scientific and societal questions. And also, ESA’s FutureEO Program, including missions designed to study oceans, ice, land and atmosphere.
As in any other technological advance, its potential usefulness is not defined from the beginning. Having access to constant information from around the world allows the development of countless applications, theoretically, and if satellite technology keeps advancing, it could allow us to track all vehicles in sight if they had an identifier above them, with drone swarms you could identify every person in an outdoor zone in matter of minutes, and many more potential use cases.
How Earth observation can be used to monitor infrastructure
In today’s interconnected world, the integrity and resilience of infrastructure are paramount to ensure the smooth functioning of societies and economies. There are increasing critical assets that are constantly exposed to natural and human-made hazards, and due to the importance of electrical, energy and transportation infrastructures, their monitoring is a high priority.
With the rapid growth of AI, the possibilities offered by the use of EO data are endless and change rapidly each week. Let’s see common use cases:
Machine Learning to identify objects and track anomalies
The most frequent neural network used when analyzing EO data is a CNN (Convolutional Neural Network) as the data consists usually of images, so when dealing with tasks like monitoring, or detecting, this will be the neural network we will tend to focus on. Now, depending on the task we are implementing we will look at different models and algorithms;
- If we want to implement a tree counting system in a specified zone, we might be interested in YOLO, a popular object detection algorithm that is also able to detect human bodies and determine if they are within restricted areas.
- If we were interested in identifying the human-built zones from a large area we would implement a ResNet, among others. We can also use additional information gathered by satellite data, which not only stores information about the visible spectrum, to identify the type of vegetation in a zone using both, the VIS and NIR (visible and near-infrared) spectra.
- Another useful neural network for spotting anomalies is the autoencoder, which is trained to reconstruct the input data. By training an autoencoder on normal images, it has difficulty reconstructing anomalies, this way it allows us to detect them based on reconstruction error, this is very useful if we want to monitor a zone and detect anomalies within it.
- If we are developing a computer vision algorithm to track vehicles in, for example, a highway section, in which its direction is almost constant, we could also implement a SIFT (Scale-invariant feature transform), an algorithm to extract important characteristics from a given image. After that, we could also implement a Kalman filter to avoid losing our tracking when the objective vision is blocked.
Machine learning models to predict natural disasters
Machine learning models can be used to predict natural disasters after gathering information from different sources. The combination of EO information received from all sources can help fine-tune the predictive models, from simple logistic regressions to machine learning models like Pangu-Weather, a Huawei Cloud’s AI model that can predict weather more accurately than state-of-the-art numerical weather prediction models at a speed 10000 times faster.
A suitable neural network for natural disaster prediction is an RNN (Recurrent Neural Network) as they are used to model time-series data, allowing for more accurate predictions or climate trends. This can be used to protect infrastructure to prevent further damage or to create evacuation plans to ensure the inhabitant’s security.
Conclusion
After reviewing all the different types of imagery and the typical use of each one, we can see the great versatility that EO data offers. All this data gathered by the different constellations and distributed by EO data providers allows its use on a larger scale. This added to the advancement of AI, will allow the creation of several projects that will accelerate progress in various areas worldwide.
EO data growth is estimated to accelerate significantly in the coming years, driven by advances in satellite technology, data processing capabilities, and increasing demand for real-time, high-resolution information about the Earth’s environment.
In our technical note, we will provide further insights into some of the innovative applications we are developing at Cactus to address the challenges posed by trees near power lines. These solutions are designed to enhance safety, improve efficiency in vegetation management, and reduce the environmental impact of maintaining clearances around power infrastructure. Stay tuned as we explore how these advancements can contribute to a more reliable and sustainable energy grid.
About Cactus
Cactai team, a space geek team, is ready to further explore your use case and tailor solutions based on EO to meet your specific needs. Whether you’re looking to optimize processes, integrate advanced technologies, or innovate within your industry, we’re here to collaborate with you every step of the way. Our goal is to ensure that your objectives are met with precision and excellence, providing the expertise and support needed to achieve success.